
Your Go Service Has a Leak and the Heap Profile May Not Tell You Why
A practical deep dive into goroutine leaks, liveness, GC reachability, and Go 1.27's goroutine leak profile.
TL;DR: A blocked goroutine is not automatically a leak. The interesting case is a goroutine whose blocked synchronization primitive can no longer be reached or unblocked by live execution. Go 1.27's goroutine leak profile uses GC reachability to identify a large class of those cases.
A production Go service can have normal CPU usage, a healthy-looking heap profile, and no obvious global deadlock, yet its goroutine count can quietly climb:
800
1,400
7,000
32,000
180,000
Nothing has crashed.
There is no single stack trace that says "this is the bug."
The service is simply accumulating goroutines that are never going to finish.
That is a goroutine leak.
But here is the interesting question:
How can a runtime determine that a blocked goroutine can never be unblocked?
To answer it, we need to connect several ideas that are usually taught separately:
- goroutines and blocking
- liveness and lifecycle
- pprof
- garbage-collector reachability
- production debugging
- and the limits of what a runtime can actually prove
Version note: The official Go 1.27 release notes are currently draft release notes. They state that Go 1.27 is expected in August 2026 and that goroutineleak is generally available in that release. Verify the final release notes before publishing version-specific claims. See the Go 1.27 Release Notes.

1. A goroutine can be alive without being useful
If you are new to Go, start here.
A goroutine is a lightweight unit of concurrent execution. You start one with the go keyword:
go doSomething()Now consider:
func worker(ch <-chan int) {
  value := <-ch
  fmt.Println(value)
}
The worker waits for a value from a channel.
If another goroutine eventually sends:
ch <- 42the worker wakes up and continues.
But what if nobody ever sends anything?
ch := make(chan int)
go worker(ch)
The goroutine remains alive and blocked.
That, by itself, is not enough to call it a leak.
A worker may legitimately wait for an event that is expected to happen later.
The stronger question is:
Does this goroutine still have a possible path to making progress and eventually terminating?
If not, we may have a goroutine leak.
2. A blocked goroutine is not automatically a leak
This distinction is where many debugging mistakes begin.
Consider a long-lived worker:
func worker(ctx context.Context, jobs <-chan Job) {
  for {
    select {
    case <-ctx.Done():
      return
    case job, ok := <-jobs:
      if !ok {
        return
      }
      process(job)
    }
  }
}
When there is no work, this goroutine can be blocked waiting on jobs.
That is normal.
Its lifecycle is explicit:
start
  ↓
wait for work
  ↓
process
  ↓
wait again
  ↓
cancel / close
  ↓
return
A leaked goroutine has a different shape:
start
↓
wait
↓
the event that could wake it is no longer possible
↓
wait forever
So the important property is not blockedness.
It is a permanent lack of progress.
3. The classic leak: returning too early
The Go 1.26 release notes use a particularly instructive pattern.
Suppose we start one goroutine per work item:
type result struct {
  res workResult
  err error
}

func processWorkItems(ws []workItem) ([]workResult, error) {
  ch := make(chan result)
  for _, w := range ws {
    w := w
    go func() {
      res, err := processWorkItem(w)
      ch <- result{res, err}
    }()
  }
  var results []workResult
  for range len(ws) {
    r := <-ch
    if r.err != nil {
      return nil, r.err
    }
    results = append(results, r.res)
  }
  return results, nil
}
There is a subtle failure path.
Imagine that one worker returns an error.
The parent immediately does:
return nil, r.errAt that moment, who is still receiving from ch?
Nobody.
The remaining workers can still reach:
ch <- result{res, err}Because ch is unbuffered, those sends block.
The parent has already returned so those workers can remain stuck permanently.
This is the kind of goroutine leak the new profiling capability is designed to help identify. The Go 1.26 release notes use this pattern to explain the feature. See the Go 1.27 Release Notes.
The key lesson is bigger than channels:
The bug is a broken lifecycle, not a broken goroutine.
4. Why this isn't simply a "memory leak"
When engineers hear memory leak, they often imagine:
allocate
↓
forget to release
↓
heap grows
Go's garbage collector changes that picture.
Objects that are no longer reachable can eventually be reclaimed.
A leaked goroutine is different.
The goroutine itself is still part of the program's live execution state. It may also retain references to other objects.
A useful mental model is:
Leaked goroutine
│
├── stack
├── references
└── blocked synchronization state
So a goroutine leak can contribute to memory growth, scheduler pressure, and broader application instability.
But the underlying bug is better described as a liveness problem:
Execution that was supposed to terminate no longer has a path to termination.
5. Enter Go's goroutine leak profile
Go 1.26 introduced the goroutine leak profile as an experimental feature. In the Go 1.27 draft release notes, it is listed as generally available under the profile name:
goroutineleakIt is supported by runtime/pprof and exposed through net/http/pprof at:
/debug/pprof/goroutineleakThe difference is conceptual.
The ordinary goroutine profile asks roughly:
What goroutines exist right now?
The leak profile asks a much stronger question:
Which blocked goroutines are in a state where they cannot possibly become unblocked?
The official Go 1.27 notes define a leaked goroutine as one blocked on a concurrency primitive such as a channel, sync.Mutex, or sync.Cond that cannot possibly become unblocked. See the Go 1.27 Release Notes.
6. The surprising part: GC reachability helps answer a concurrency question
This is the most interesting part of the feature.
Suppose:
G = a blocked goroutine
P = the synchronization primitive it is waiting on
Conceptually:
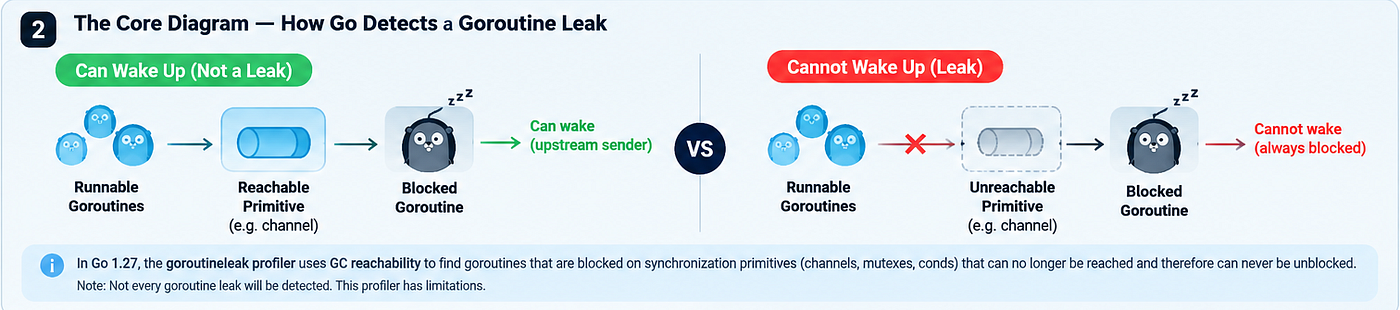
G ── waits on ──> PNow imagine that P is unreachable from any runnable goroutine or from any goroutine that those runnable goroutines could unblock.
Then there is no execution path left that can operate on P and wake G.
So:
P is unreachable
↓
P cannot be unblocked
↓
G cannot wake up
↓
G is leaked
That is the core idea described by the Go runtime itself. See the Go 1.27 Release Notes.
7. Why garbage collection is involved
Garbage collectors are usually introduced as memory-management systems.
Their basic question is:
Which objects are reachable?
Here, reachability becomes evidence about future execution.
The runtime can reason about whether the synchronization object needed to wake a blocked goroutine is still reachable from the live execution graph.
That creates a useful conceptual bridge:
Garbage collection
│
▼
Reachability
│
▼
Can the blocked primitive still be reached?
│
▼
Can the goroutine still make progress?
│
▼
Liveness
The runtime is not saying:
"Unreachable means goroutine leak."
It is using reachability to prove something stronger about a blocked goroutine's future.
That is what makes this feature interesting from a runtime-design perspective.

8. What can it detect and what can it miss?
The approach targets a large class of goroutines blocked on concurrency primitives.
But it is not a universal theorem prover for goroutine liveness.
The official notes explicitly warn that this approach can miss leaks when the synchronization primitive is still reachable through global variables or local variables of runnable goroutines. See the Go 1.27 Release Notes.
Why?
Because:
reachable ≠ will actually be usedA primitive can remain reachable in memory while the application has logically abandoned it.
The runtime can reason much more reliably about reachability than about programmer intent.
That is a fundamental limitation and an important one to understand before treating the profile as an oracle.
9. Leak vs deadlock vs backpressure
These concepts are often mixed.
They are related, but they are not the same thing.
Goroutine leak
A goroutine remains alive even though its intended lifecycle has effectively ended.
spawn
↓
block
↓
no termination path
Deadlock
Progress becomes impossible because goroutines are waiting on each other or on a cycle of resources.
G1 → waits for G2
G2 → waits for G1
Backpressure
The system intentionally slows producers because consumers cannot keep up.
producer → queue → consumer
              ↑
           pressure
A blocked goroutine is not automatically a leak.
A growing goroutine count is not automatically a deadlock.
And a full queue is not automatically a bug.
The engineering question is:
What lifecycle did we intend, and what lifecycle did the runtime actually observe?
10. Every long-lived goroutine needs a lifecycle
A healthy long-lived goroutine usually has an explicit lifecycle:
Start
↓
Work / Wait
↓
Cancellation / Shutdown
↓
Stop
For example:
func worker(ctx context.Context, jobs <-chan Job) {
  for {
    select {
    case <-ctx.Done():
      return
    case job, ok := <-jobs:
      if !ok {
        return
      }
      process(job)
    }
  }
}
This doesn't mathematically prove that your service cannot leak a goroutine.
But it makes the goroutine's lifetime explicit and testable.
11. The design principle: ownership
Before creating a long-lived goroutine, ask:
- Who starts it?
- Who owns it?
- What makes it stop?
- What happens on error?
- What happens on cancellation?
- What happens during shutdown?
A useful rule of thumb is:
Every long-lived goroutine should have an owner and a termination story.
That principle is often more valuable than any profiling tool because it prevents whole classes of lifecycle bugs before they reach production.
12. runtime.NumGoroutine() is still useful
A leak profile does not replace the ordinary goroutine count.
Track it with signals such as:
- goroutines
- heap allocation
- GC activity
- request latency
- queue depth
- error rate
The trend is often more informative than the absolute number.
For example:
goroutine count ↑
request volume ≈ constant
queue depth ≈ constant
↓
investigate lifecycle
A service with thousands of goroutines can be perfectly healthy.
A service that normally sits at 500 and climbs steadily to 10,000 is much more suspicious.
13. How I would investigate a suspected leak
I would not start by randomly increasing channel buffers.
I would build evidence.
Step 1 — Establish the trend
Track:
runtime.NumGoroutine()over time.
Step 2 — Inspect the ordinary goroutine profile
Look at:
/debug/pprof/goroutineFind large groups of similar stacks.
Step 3 — Ask whether the blocked state is legitimate
For each major group:
- What is it waiting for?
- Who should wake it?
- Who owns that lifecycle?
- When should it stop?
Step 4 — Use goroutineleak
On Go 1.27, inspect:
/debug/pprof/goroutineleakor access the same profile through runtime/pprof.
Step 5 — Correlate with application events
Look at:
- request rate
- errors
- timeouts
- cancellations
- queue depth
- shutdown events
- restarts
A goroutine leak is often a symptom of a lifecycle bug elsewhere.
14. The bigger lesson: observability is becoming more semantic
Modern Go diagnostics are increasingly useful not only for measuring resources, but for explaining behavior.
Think of the toolbox as layers:
pprof
├── CPU
├── heap
├── goroutine
└── goroutineleak

trace
├── scheduler
├── GC
├── goroutine execution
└── synchronization

metrics
├── runtime
└── application
Good observability should not stop at:
"Something is wrong."
It should help us ask:
"Which assumption about the system has been violated?"
For a goroutine leak, that violated assumption is often:
A goroutine that no longer has useful work should eventually have a path to termination.
15. Final takeaway
The most interesting part of Go's goroutine leak profile is not the endpoint itself.
It is the reasoning behind it.
A runtime that already knows how to reason about reachability can use that information to reason about liveness for a particular class of blocked goroutines.
The mental model is:
Garbage collection
+
Concurrency
↓
Reachability
↓
Liveness
↓
Goroutine leak detection
And the engineering lesson is even simpler:
Concurrency bugs are often lifecycle bugs.
A goroutine should not merely have a starting point.
It should have a reason to exist, an owner, a cancellation path, and a well-defined ending.
One question to take back to your codebase
Before launching your next long-lived goroutine, ask:
Who owns this goroutine, what wakes it up, and what makes it return?
If there is no clear answer, you may already have a lifecycle bug waiting to happen.
References
- Go 1.27 Release Notes: https://go.dev/doc/go1.27
- Go 1.26 Release Notes: https://go.dev/doc/go1.26
- Go Diagnostics: https://go.dev/doc/diagnostics
- runtime/pprof: https://pkg.go.dev/runtime/pprof
- Goroutine leak profile runtime tests: https://go.dev/src/runtime/testdata/testgoroutineleakprofile/